Dramatic Increase in Health Spending Around the World
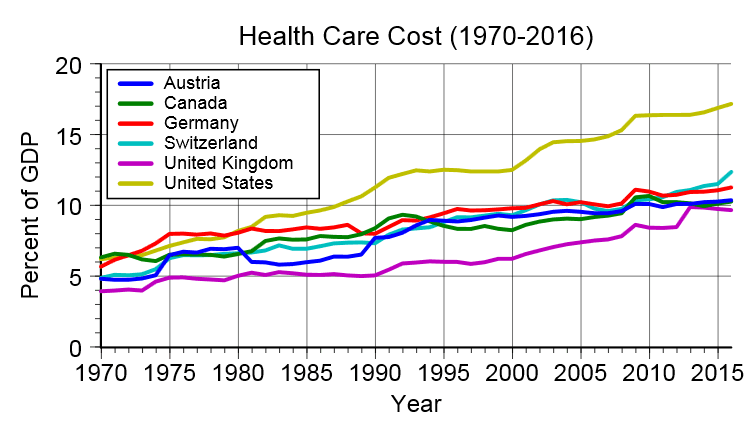
According to the World Health Organization, the health expenditure per country has been growing steadily since the 1990s. Some countries have reported dramatic increases while the level of healthcare has remained the same.
As WHO reports, here are some interesting facts in regards to spending on health around the world. (1)
| Total global expenditure for health | US$ 6.5 trillion |
| Total global expenditure for health per person per year | US$ 948 |
| Country with highest total spending per person per year on health | United States (US$ 8362) |
| Country with lowest total spending per person per year on health | Eritrea (US$ 12) |
| Country with highest government spending per person per year on health | Luxembourg (US$ 6906) |
| Country with lowest government spending per person per year on health | Myanmar (US$ 2) |
| Country with highest annual out-of-pocket household spending on health | Switzerland (US$ 2412) |
| Country with lowest annual out-of-pocket household spending on health | Kiribati (US$ 0.2) |
| Average amount spent per person per year on health in countries belonging to the Organisation for Economic Co-operation and Development (OECD) | US$ 4380 |
| Percentage of the world’s population living in OECD countries | 18% |
| Percentage of the world’s total financial resources devoted to health currently spent in OECD countries | 84% |
| WHO estimate of minimum spending per person per year needed to provide basic, life-saving services | US$ 44 |
| Number of WHO Member States where health spending – including spending by government, households and the private sector and funds provided by external donors – is lower than US$ 50 per person per year | 34 |
| Number of WHO Member States where health spending is lower than US$ 20 per person per year | 7 |
| Percentage of funds spent on health in WHO’s Africa Region that has been provided by donors | 11% |
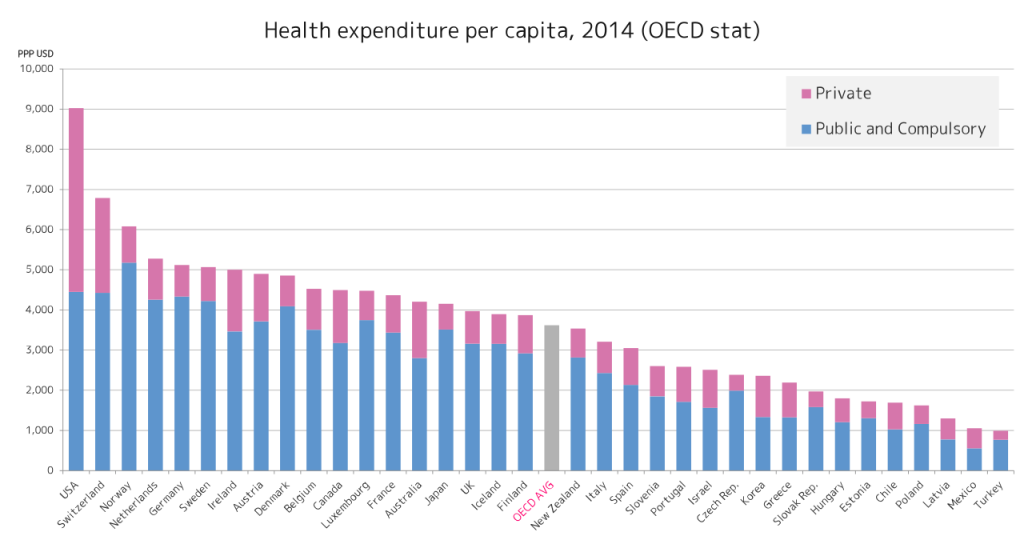
The health expenditure per capita in the United States in 2014 is more than double the OECD (Organisation for Economic Co-operation and Development) average.
How does your country compare to others? (2)
2016 OECD member rankings
| Rank | Country | % of health expenditure funded by government (3) |
| 1 | Norway | 85.2% |
| 2 | Germany | 84.6% |
| 3 | Denmark | 84.1% |
| 3 | Japan | 84.1% |
| 5 | Sweden | 83.9% |
| 6 | Czech Republic | 83.4% |
| 7 | Luxembourg | 83.0% |
| 8 | Iceland | 82.1% |
| 9 | Netherlands | 80.8% |
| 10 | New Zealand | 80.2% |
| 11 | Slovakia | 79.8% |
| 12 | Turkey | 79.4% |
| 13 | United Kingdom | 79.2% |
| 14 | France | 78.8% |
| 15 | Belgium | 77.3% |
| 16 | Estonia | 76.1% |
| 17 | Austria | 75.7% |
| 18 | Italy | 75.0% |
| 19 | Finland | 74.2% |
| 20 | Slovenia | 71.8% |
| 21 | Spain | 70.6% |
| 22 | Ireland | 70.2% |
| 23 | Canada | 70.0% |
| 24 | Poland | 69.0% |
| 25 | Hungary | 68.3% |
| 26 | Australia | 67.8% |
| 27 | Portugal | 66.2% |
| 28 | Switzerland | 63.6% |
| 29 | Israel | 61.3% |
| 30 | Chile | 60.7% |
| 31 | Greece | 59.3% |
| 32 | South Korea | 56.4% |
| 33 | Mexico | 51.7% |
| 34 | United States | 49.1% |
Source:
(1) http://data.worldbank.org/indicator/SH.XPD.PCAP?end=2014&start=1995&view=map
(2) http://www.who.int/mediacentre/factsheets/fs319/en/


